-
Notifications
You must be signed in to change notification settings - Fork 16
NewIn22
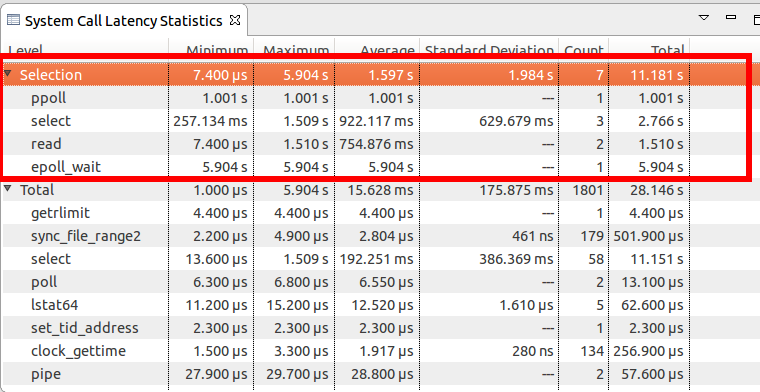
The Latency statistics view now will display the local statistics for a selection range in the trace. This is applicable to the Latency statistics view created by the data-driven pattern analysis or in Java like the System Call analysis.

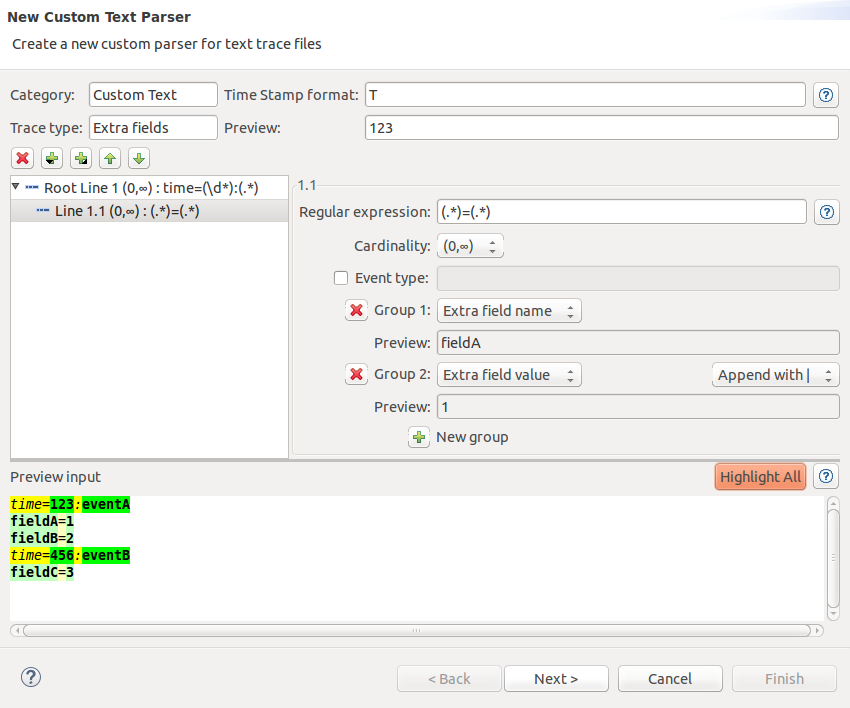
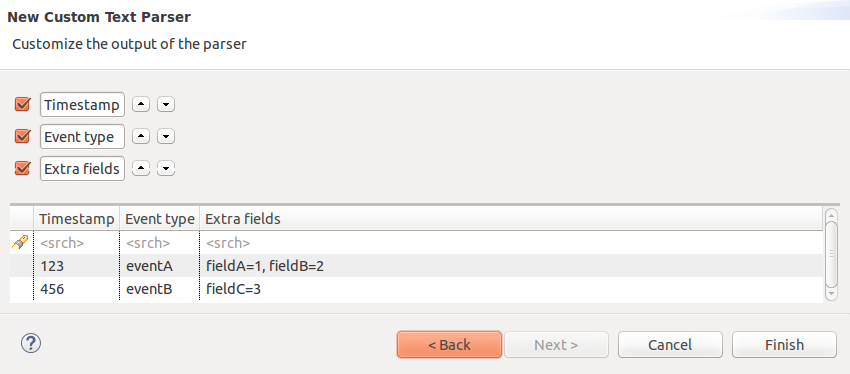
The custom parser text and XML wizard now allows the user to define per-event extra fields whose field name are dynamically extracted from the trace event data.


A new compression library is used allowing the user to import new archive formats and providing better handling of archives, for example ignoring pax headers in tar files.
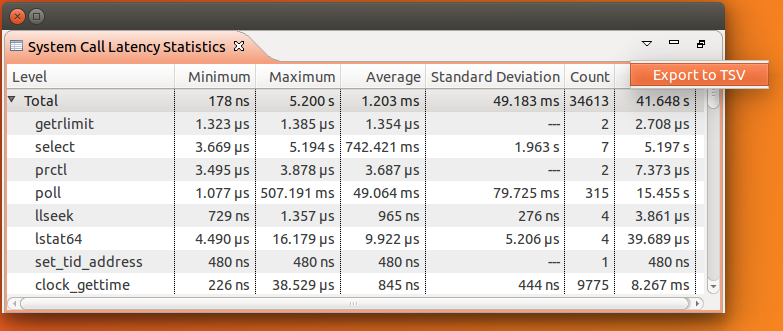
The segment store internal data structure now supports lazy loading to improve its efficiency. The table data and statistics can be exported to TSV format.

Double-clicking on the Flame Graph view now zooms to the selected flame graph event.
functionalities.
![]()
See Bugzilla report Bugs Fixed in Trace Compass 2.2.0